- Info was updated
- just now
- Days on Market
- 112
- Views
- N/A
- Saves
- N/A
- Property Estimate
- $185,000
- Return on InvestmentROI
10.98%10.98%
- Long-T Rental Confidence
- LT Rental Confidence
- N/A
- Cap Rate
- 7.6%
- Rent / Price
- 1.1%
- Address:
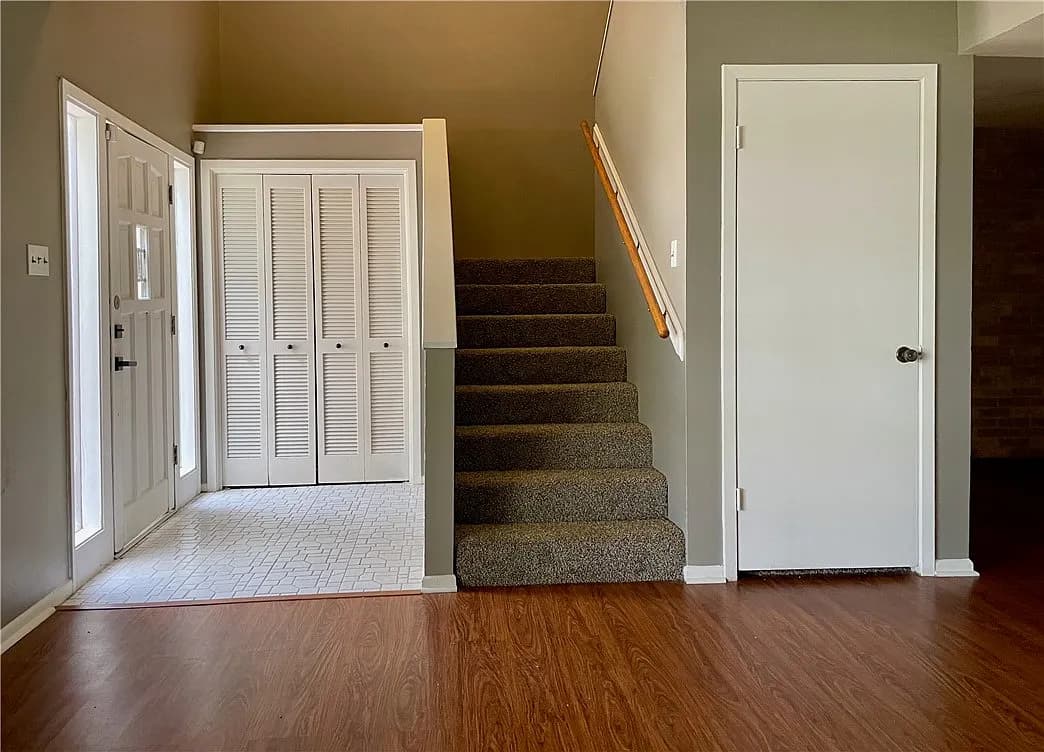
- 5444 Stonegate Way, Corpus Christi, TX 78411
- Property Type
- Townhouse
- Area
- 1,871 sqft
- Bed & Bath
- 3bd / 3ba
- Property Condition
- Lightly-Renovated
N
- Contact Realtor
- N/A
Property Report
May take a moment to make the report.
- Research Market
- TX 78411
- Local Property Manager
- N/A
- Area
- 1871 sqft
- Bed
- 3
- Bath
- 3
Property Details
- HOA Cost
- None
- Year Built
- 1974
- Price Per Square Foot
- $99 /sqft
- Lot Size
- 4,182 sqft
- Property Parking
- N/A
- Public Transport Score
- N/A
- Bike Score
- N/A
- Walkability
- N/A
Seller Description
Schools
- School District:
- N/A
Property Map
Climate Risk
ROI Breakdown
- Return on Investment
10.98%10.98% ROI
- Total Income
- $2,039
- Total Expenses
- $1,494
- Total Appreciation
- $449,044
Income
Monthly
| Monthly Income | $2,039 |
Total Income
$2,039
Expenses
Monthly
| Mortgage | $624 |
| PMI | $0 |
| Maintenance | $102 |
| Cap Ex | $143 |
| Property Tax | $312 |
| Property Management | $163 |
| Home Insurance | $65 |
| HOA | $0 |
| Vacancy | $86 |
Total Expenses
$1,494
Appreciation
30 yrs
| Annual House Appreciation | 3% |
Total Appreciation
$449,044
Return on Investment
30 yrs
| Total Initial Cost | $49,025 |
| Total Expenses | $930,245 |
| Total Appreciation | $449,044 |
| Selling Fee (6%) | $26,943 |
| Total Income | $1,625,626 |
Total ROI
10.98%
Cash-on-Cash
1.11%
Cap Rate
7.58%
Cash Flow
Expense Breakdown
Appreciation Over Time
- Appreciation Rate
- 3%
Income Over Time
- Income Rate
- 5%
Rental Opportunities
Zillow
Long-Term Rental Information
- Average Monthly Revenue
- $2,039
- Average Monthly Expense
- $1,494
- Monthly Property Tax
- $312
- Estimated Monthly Profit
- $545
- Long-T Rental Confidence
- LT Rental Confidence
- N/A
Airbnb
Short-Term Rental Information
- Average Monthly Rate
- $4,449
- Average Monthly Expense
- $3,496
- Average Nightly Rate
- $246
- Average Monthly Occupancy
- 60%
- Estimated Monthly Profit
- $952
- Short-T Rental Confidence
- ST Rental Confidence
- N/A