- Info was updated
- just now
- Days on Market
- 264
- Views
- N/A
- Saves
- N/A
- Property Estimate
- $240,000
- Return on InvestmentROI
11.37%11.37%
- Long-T Rental Confidence
- LT Rental Confidence
- High
- Cap Rate
- 8.6%
- Rent / Price
- .99%
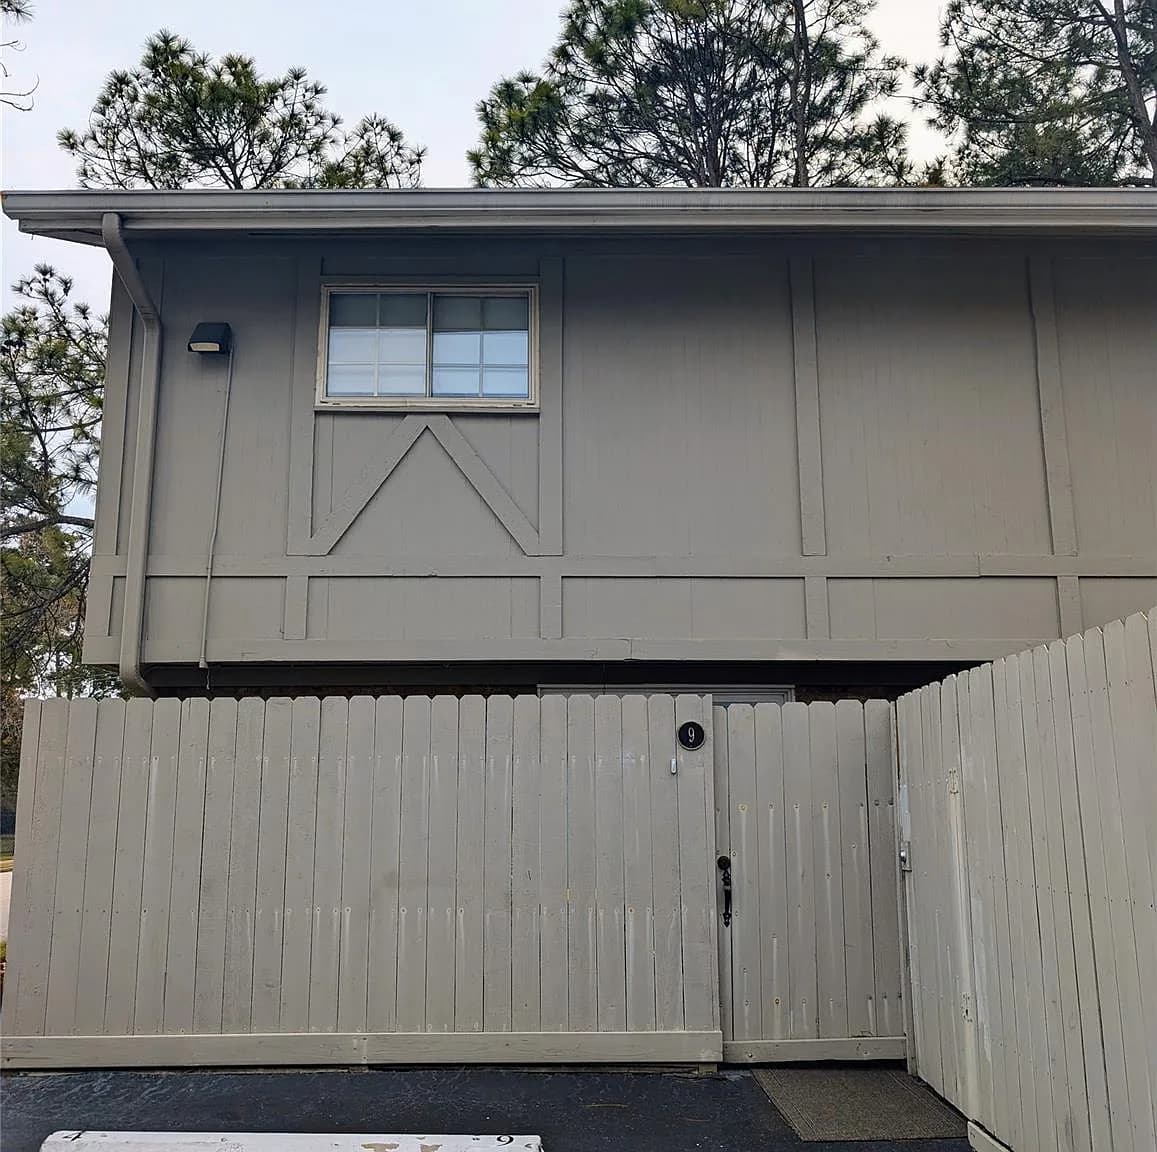
- Address:
- 515 Tallowood Rd UNIT 9, Houston, TX 77024
- Property Type
- Townhouse
- Area
- 1,392 sqft
- Bed & Bath
- 2bd / 3ba
- Property Condition
- Turn-Key
L
- Contact Realtor
- Luis Chavez
Property Report
May take a moment to make the report.
- Research Market
- TX 77024
- Local Property Manager
- Meadows Property Group
- Area
- 1392 sqft
- Bed
- 2
- Bath
- 3
Property Details
- HOA Cost
- None
- Year Built
- 1970
- Price Per Square Foot
- $172 /sqft
- Lot Size
- 3 acres
- Property Parking
- N/A
- Public Transport Score
- N/A
- Bike Score
- N/A
- Walkability
- N/A
Seller Description
Schools
- School District:
- N/A
Property Map
Climate Risk
ROI Breakdown
- Return on Investment
11.37%11.37% ROI
- Total Income
- $2,374
- Total Expenses
- $1,473
- Total Appreciation
- $582,543
Income
Monthly
| Monthly Income | $2,374 |
Total Income
$2,374
Expenses
Monthly
| Mortgage | $809 |
| PMI | $0 |
| Maintenance | $119 |
| Cap Ex | $166 |
| Property Tax | $5 |
| Property Management | $190 |
| Home Insurance | $84 |
| HOA | $0 |
| Vacancy | $100 |
Total Expenses
$1,473
Appreciation
30 yrs
| Annual House Appreciation | 3% |
Total Appreciation
$582,543
Return on Investment
30 yrs
| Total Initial Cost | $63,600 |
| Total Expenses | $830,350 |
| Total Appreciation | $582,543 |
| Selling Fee (6%) | $34,953 |
| Total Income | $1,892,710 |
Total ROI
11.37%
Cash-on-Cash
1.42%
Cap Rate
8.55%
Cash Flow
Expense Breakdown
Appreciation Over Time
- Appreciation Rate
- 3%
Income Over Time
- Income Rate
- 5%
Rental Opportunities
Zillow
Long-Term Rental Information
- Average Monthly Revenue
- $2,374
- Average Monthly Expense
- $1,473
- Monthly Property Tax
- $5
- Estimated Monthly Profit
- $901
- Long-T Rental Confidence
- LT Rental Confidence
- High
Airbnb
Short-Term Rental Information
- Average Monthly Rate
- $6,335
- Average Monthly Expense
- $4,426
- Average Nightly Rate
- $500
- Average Monthly Occupancy
- 42%
- Estimated Monthly Profit
- $1,908
- Short-T Rental Confidence
- ST Rental Confidence
- N/A