- Info was updated
- just now
- Days on Market
- 116
- Views
- N/A
- Saves
- N/A
- Property Estimate
- $149,995
- Return on InvestmentROI
11.13%11.13%
- Long-T Rental Confidence
- LT Rental Confidence
- Very High
- Cap Rate
- 7.9%
- Rent / Price
- 1.06%
- Address:
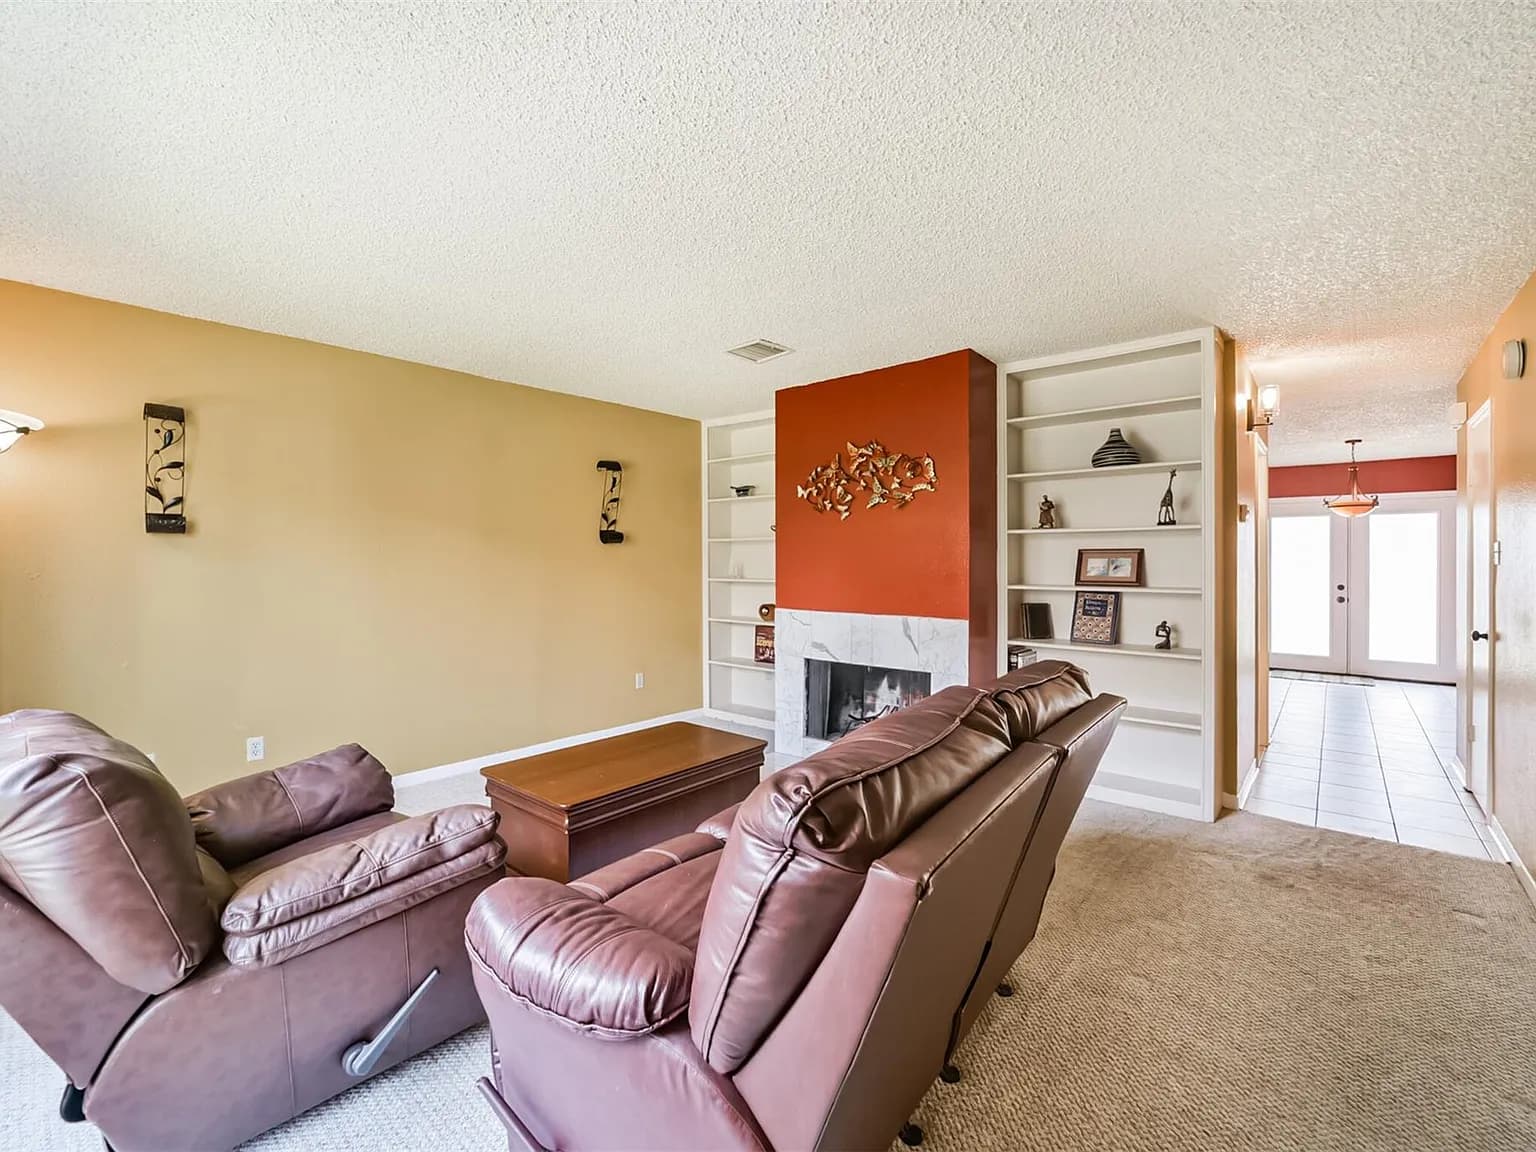
- 9345 Westwood Village Dr #30, Houston, TX 77036
- Property Type
- Townhouse
- Area
- 1,440 sqft
- Bed & Bath
- 2bd / 2ba
- Property Condition
- Turn-Key
N
- Contact Realtor
- N/A
Property Report
May take a moment to make the report.
- Research Market
- TX 77036
- Local Property Manager
- N/A
- Area
- 1440 sqft
- Bed
- 2
- Bath
- 2
Property Details
- HOA Cost
- None
- Year Built
- 1979
- Price Per Square Foot
- $104 /sqft
- Lot Size
- 1,843 sqft
- Property Parking
- N/A
- Public Transport Score
- N/A
- Bike Score
- N/A
- Walkability
- N/A
Seller Description
Schools
- School District:
- N/A
Property Map
Climate Risk
ROI Breakdown
- Return on Investment
11.13%11.13% ROI
- Total Income
- $1,596
- Total Expenses
- $1,111
- Total Appreciation
- $364,077
Income
Monthly
| Monthly Income | $1,596 |
Total Income
$1,596
Expenses
Monthly
| Mortgage | $506 |
| PMI | $0 |
| Maintenance | $80 |
| Cap Ex | $112 |
| Property Tax | $166 |
| Property Management | $128 |
| Home Insurance | $52 |
| HOA | $0 |
| Vacancy | $67 |
Total Expenses
$1,111
Appreciation
30 yrs
| Annual House Appreciation | 3% |
Total Appreciation
$364,077
Return on Investment
30 yrs
| Total Initial Cost | $39,749 |
| Total Expenses | $672,987 |
| Total Appreciation | $364,077 |
| Selling Fee (6%) | $21,845 |
| Total Income | $1,272,437 |
Total ROI
11.13%
Cash-on-Cash
1.22%
Cap Rate
7.93%
Cash Flow
Expense Breakdown
Appreciation Over Time
- Appreciation Rate
- 3%
Income Over Time
- Income Rate
- 5%
Rental Opportunities
Zillow
Long-Term Rental Information
- Average Monthly Revenue
- $1,596
- Average Monthly Expense
- $1,111
- Monthly Property Tax
- $166
- Estimated Monthly Profit
- $485
- Long-T Rental Confidence
- LT Rental Confidence
- Very High
Airbnb
Short-Term Rental Information
- Average Monthly Rate
- $1,376
- Average Monthly Expense
- $1,599
- Average Nightly Rate
- $85
- Average Monthly Occupancy
- 54%
- Estimated Monthly Profit
- -$224
- Short-T Rental Confidence
- ST Rental Confidence
- N/A