- Info was updated
- just now
- Days on Market
- 17
- Views
- N/A
- Saves
- N/A
- Property Estimate
- $115,000
- Return on InvestmentROI
12.24%12.24%
- Long-T Rental Confidence
- LT Rental Confidence
- N/A
- Cap Rate
- 11.2%
- Rent / Price
- 1.45%
- Address:
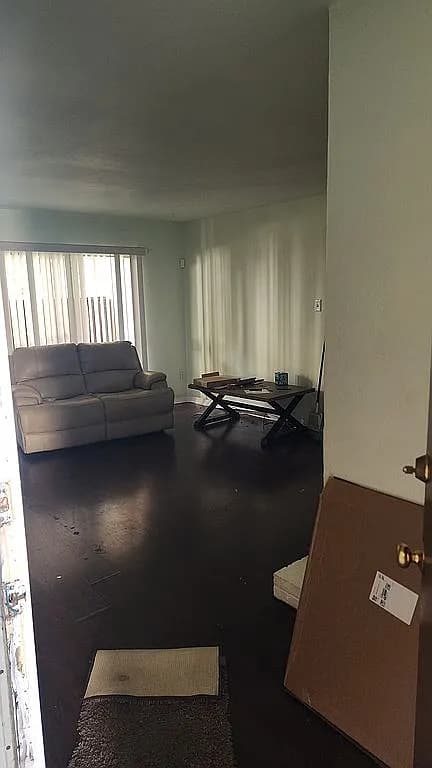
- 12830 Midway Rd APT 1118, Dallas, TX 75244
- Property Type
- CONDO
- Area
- 987 sqft
- Bed & Bath
- 2bd / 2ba
- Property Condition
- Fixer-Upper
N
- Contact Realtor
- N/A
Property Report
May take a moment to make the report.
- Research Market
- TX 75244
- Local Property Manager
- N/A
- Area
- 987 sqft
- Bed
- 2
- Bath
- 2
Property Details
- HOA Cost
- None
- Year Built
- 1970
- Price Per Square Foot
- $117 /sqft
- Lot Size
- 8 acres
- Property Parking
- N/A
- Public Transport Score
- N/A
- Bike Score
- N/A
- Walkability
- N/A
Seller Description
Schools
- School District:
- N/A

Oops, we don't seem to have data on schools in this area.
Property Map
ROI Breakdown
- Return on Investment
12.24%12.24% ROI
- Total Income
- $1,667
- Total Expenses
- $980
- Total Appreciation
- $279,135
Income
Monthly
| Monthly Income | $1,667 |
Total Income
$1,667
Expenses
Monthly
| Mortgage | $388 |
| PMI | $0 |
| Maintenance | $83 |
| Cap Ex | $117 |
| Property Tax | Estimate$149 |
| Property Management | $133 |
| Home Insurance | $40 |
| HOA | $0 |
| Vacancy | $70 |
Total Expenses
$980
Appreciation
30 yrs
| Annual House Appreciation | 3% |
Total Appreciation
$279,135
Return on Investment
30 yrs
| Total Initial Cost | $30,475 |
| Total Expenses | $618,741 |
| Total Appreciation | $279,135 |
| Selling Fee (6%) | $16,748 |
| Total Income | $1,329,043 |
Total ROI
12.24%
Cash-on-Cash
2.25%
Cap Rate
11.22%
Cash Flow
Expense Breakdown
Appreciation Over Time
- Appreciation Rate
- 3%
Income Over Time
- Income Rate
- 5%
Rental Opportunities
Zillow
Long-Term Rental Information
- Average Monthly Revenue
- $1,667
- Average Monthly Expense
- $980
- Monthly Property Tax
- $149
- Estimated Monthly Profit
- $687
- Long-T Rental Confidence
- LT Rental Confidence
- N/A
Airbnb
Short-Term Rental Information
- Average Monthly Rate
- $1,967
- Average Monthly Expense
- $1,717
- Average Nightly Rate
- $131
- Average Monthly Occupancy
- 51%
- Estimated Monthly Profit
- $250
- Short-T Rental Confidence
- ST Rental Confidence
- N/A