- Info was updated
- just now
- Days on Market
- 75
- Views
- N/A
- Saves
- N/A
- Property Estimate
- $255,000
- Return on InvestmentROI
11.58%11.58%
- Long-T Rental Confidence
- LT Rental Confidence
- N/A
- Cap Rate
- 9.1%
- Rent / Price
- 1.1%
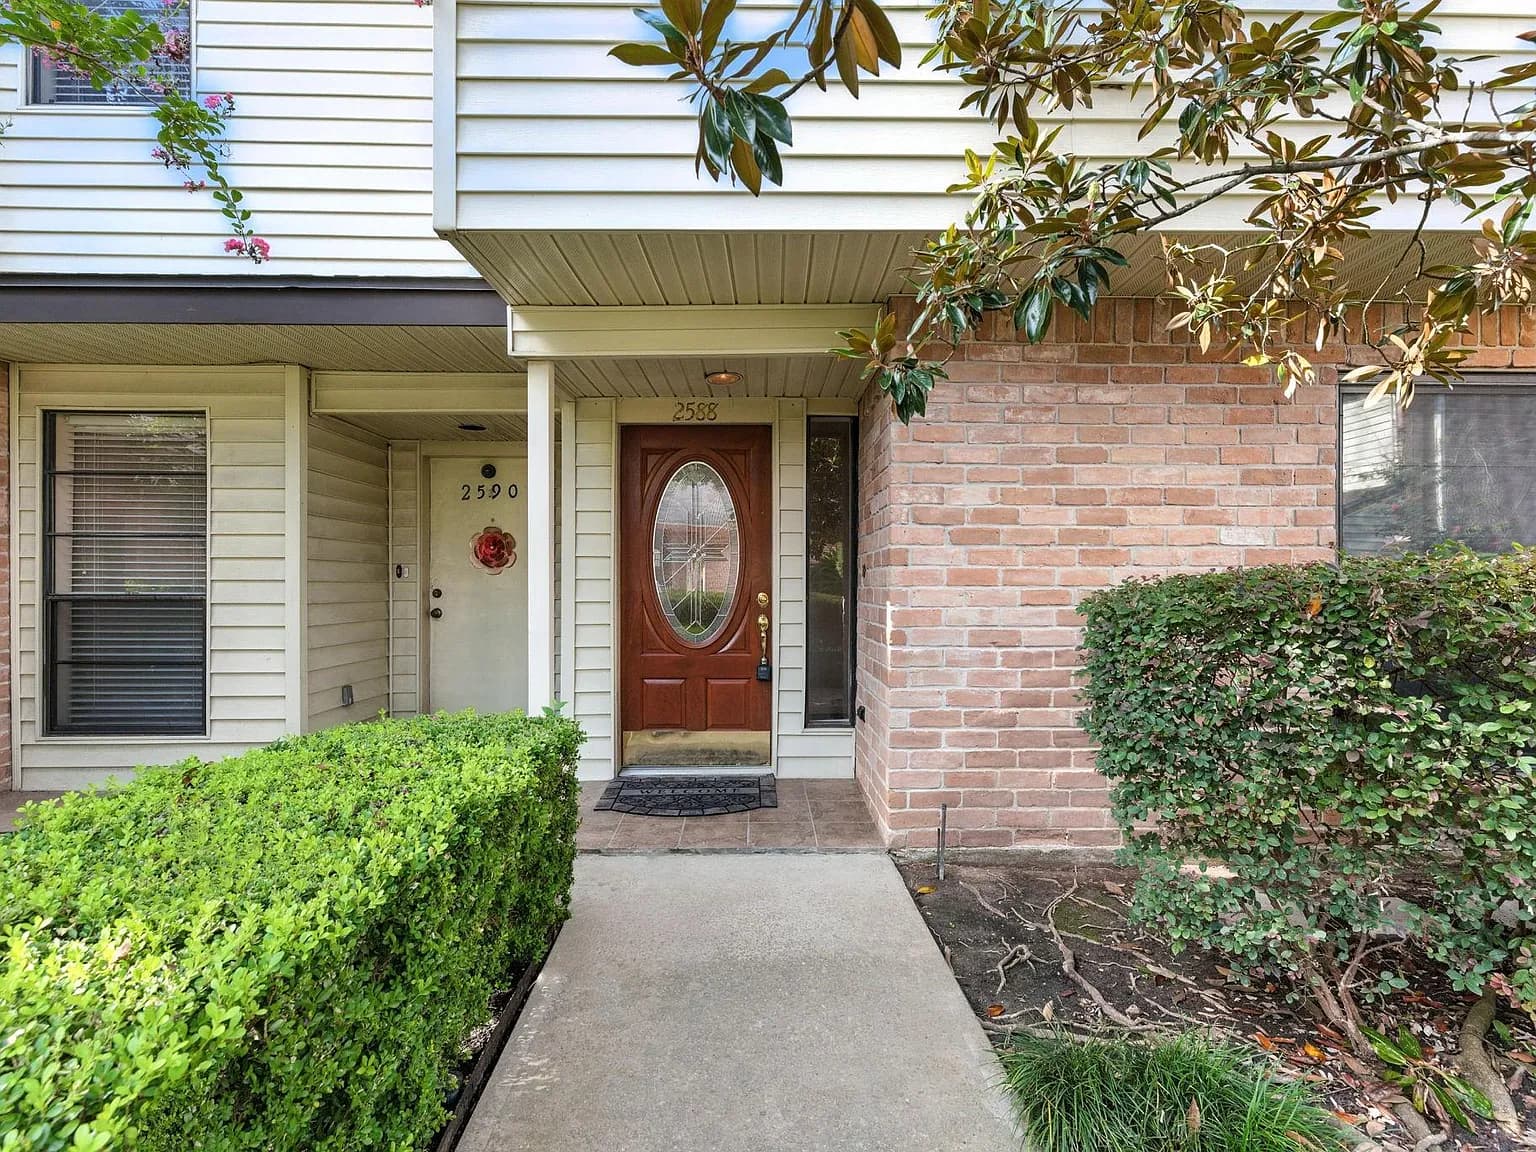
- Address:
- 2588 Bering Dr, Houston, TX 77057
- Property Type
- Townhouse
- Area
- 1,935 sqft
- Bed & Bath
- 3bd / 3ba
- Property Condition
- Turn-Key
N
- Contact Realtor
- N/A
Property Report
May take a moment to make the report.
- Research Market
- TX 77057
- Local Property Manager
- N/A
- Area
- 1935 sqft
- Bed
- 3
- Bath
- 3
Property Details
- HOA Cost
- None
- Year Built
- 1979
- Price Per Square Foot
- $132 /sqft
- Lot Size
- 5 acres
- Property Parking
- N/A
- Public Transport Score
- N/A
- Bike Score
- N/A
- Walkability
- N/A
Seller Description
Schools
- School District:
- N/A
Property Map
Climate Risk
ROI Breakdown
- Return on Investment
11.58%11.58% ROI
- Total Income
- $2,804
- Total Expenses
- $1,720
- Total Appreciation
- $618,952
Income
Monthly
| Monthly Income | $2,804 |
Total Income
$2,804
Expenses
Monthly
| Mortgage | $860 |
| PMI | $0 |
| Maintenance | $140 |
| Cap Ex | $196 |
| Property Tax | $93 |
| Property Management | $224 |
| Home Insurance | $89 |
| HOA | $0 |
| Vacancy | $118 |
Total Expenses
$1,720
Appreciation
30 yrs
| Annual House Appreciation | 3% |
Total Appreciation
$618,952
Return on Investment
30 yrs
| Total Initial Cost | $67,575 |
| Total Expenses | $1,007,709 |
| Total Appreciation | $618,952 |
| Selling Fee (6%) | $37,137 |
| Total Income | $2,235,534 |
Total ROI
11.58%
Cash-on-Cash
1.6%
Cap Rate
9.15%
Cash Flow
Expense Breakdown
Appreciation Over Time
- Appreciation Rate
- 3%
Income Over Time
- Income Rate
- 5%
Rental Opportunities
Zillow
Long-Term Rental Information
- Average Monthly Revenue
- $2,804
- Average Monthly Expense
- $1,720
- Monthly Property Tax
- $93
- Estimated Monthly Profit
- $1,084
- Long-T Rental Confidence
- LT Rental Confidence
- N/A
Airbnb
Short-Term Rental Information
- Average Monthly Rate
- $5,050
- Average Monthly Expense
- $3,925
- Average Nightly Rate
- $318
- Average Monthly Occupancy
- 54%
- Estimated Monthly Profit
- $1,125
- Short-T Rental Confidence
- ST Rental Confidence
- N/A