- Info was updated
- just now
- Days on Market
- 203
- Views
- N/A
- Saves
- N/A
- Property Estimate
- $109,000
- Return on InvestmentROI
12.13%12.13%
- Long-T Rental Confidence
- LT Rental Confidence
- N/A
- Cap Rate
- 10.9%
- Rent / Price
- 1.5%
- Address:
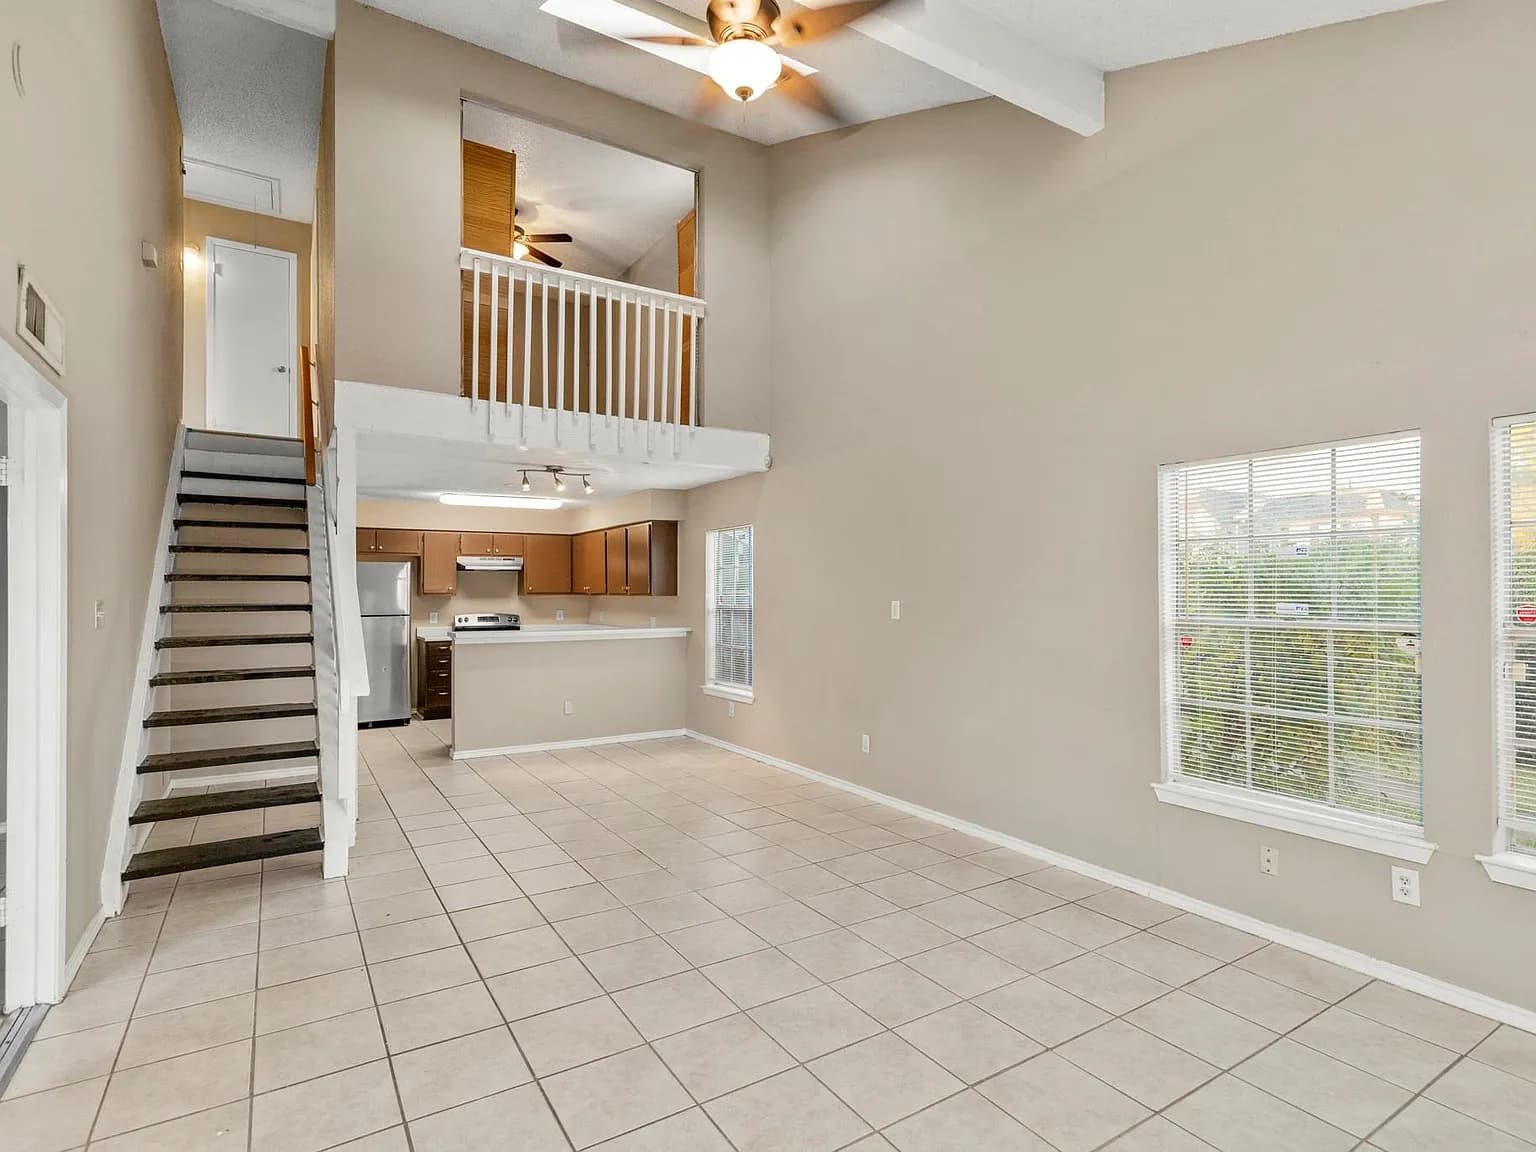
- 12102 Bob White Dr #121, Houston, TX 77035
- Property Type
- Townhouse
- Area
- 1,244 sqft
- Bed & Bath
- 3bd / 2ba
- Property Condition
- Turn-Key
P
- Contact Realtor
- Premier Broker Flex Atlanta GA
Property Report
May take a moment to make the report.
- Research Market
- TX 77035
- Local Property Manager
- Keller Williams Memorial
- Area
- 1244 sqft
- Bed
- 3
- Bath
- 2
Property Details
- HOA Cost
- None
- Year Built
- 1980
- Price Per Square Foot
- $88 /sqft
- Lot Size
- 1,111 sqft
- Property Parking
- N/A
- Public Transport Score
- N/A
- Bike Score
- N/A
- Walkability
- N/A
Seller Description
Schools
- School District:
- N/A
Property Map
Climate Risk
ROI Breakdown
- Return on Investment
12.13%12.13% ROI
- Total Income
- $1,640
- Total Expenses
- $1,021
- Total Appreciation
- $264,572
Income
Monthly
| Monthly Income | $1,640 |
Total Income
$1,640
Expenses
Monthly
| Mortgage | $368 |
| PMI | $0 |
| Maintenance | $82 |
| Cap Ex | $115 |
| Property Tax | $218 |
| Property Management | $131 |
| Home Insurance | $38 |
| HOA | $0 |
| Vacancy | $69 |
Total Expenses
$1,021
Appreciation
30 yrs
| Annual House Appreciation | 3% |
Total Appreciation
$264,572
Return on Investment
30 yrs
| Total Initial Cost | $28,885 |
| Total Expenses | $660,883 |
| Total Appreciation | $264,572 |
| Selling Fee (6%) | $15,874 |
| Total Income | $1,307,517 |
Total ROI
12.13%
Cash-on-Cash
2.14%
Cap Rate
10.86%
Cash Flow
Expense Breakdown
Appreciation Over Time
- Appreciation Rate
- 3%
Income Over Time
- Income Rate
- 5%
Rental Opportunities
Zillow
Long-Term Rental Information
- Average Monthly Revenue
- $1,640
- Average Monthly Expense
- $1,021
- Monthly Property Tax
- $218
- Estimated Monthly Profit
- $619
- Long-T Rental Confidence
- LT Rental Confidence
- N/A
Airbnb
Short-Term Rental Information
- Average Monthly Rate
- $0
- Average Monthly Expense
- $745
- Average Nightly Rate
- $0
- Average Monthly Occupancy
- 0%
- Estimated Monthly Profit
- -$745
- Short-T Rental Confidence
- ST Rental Confidence
- N/A